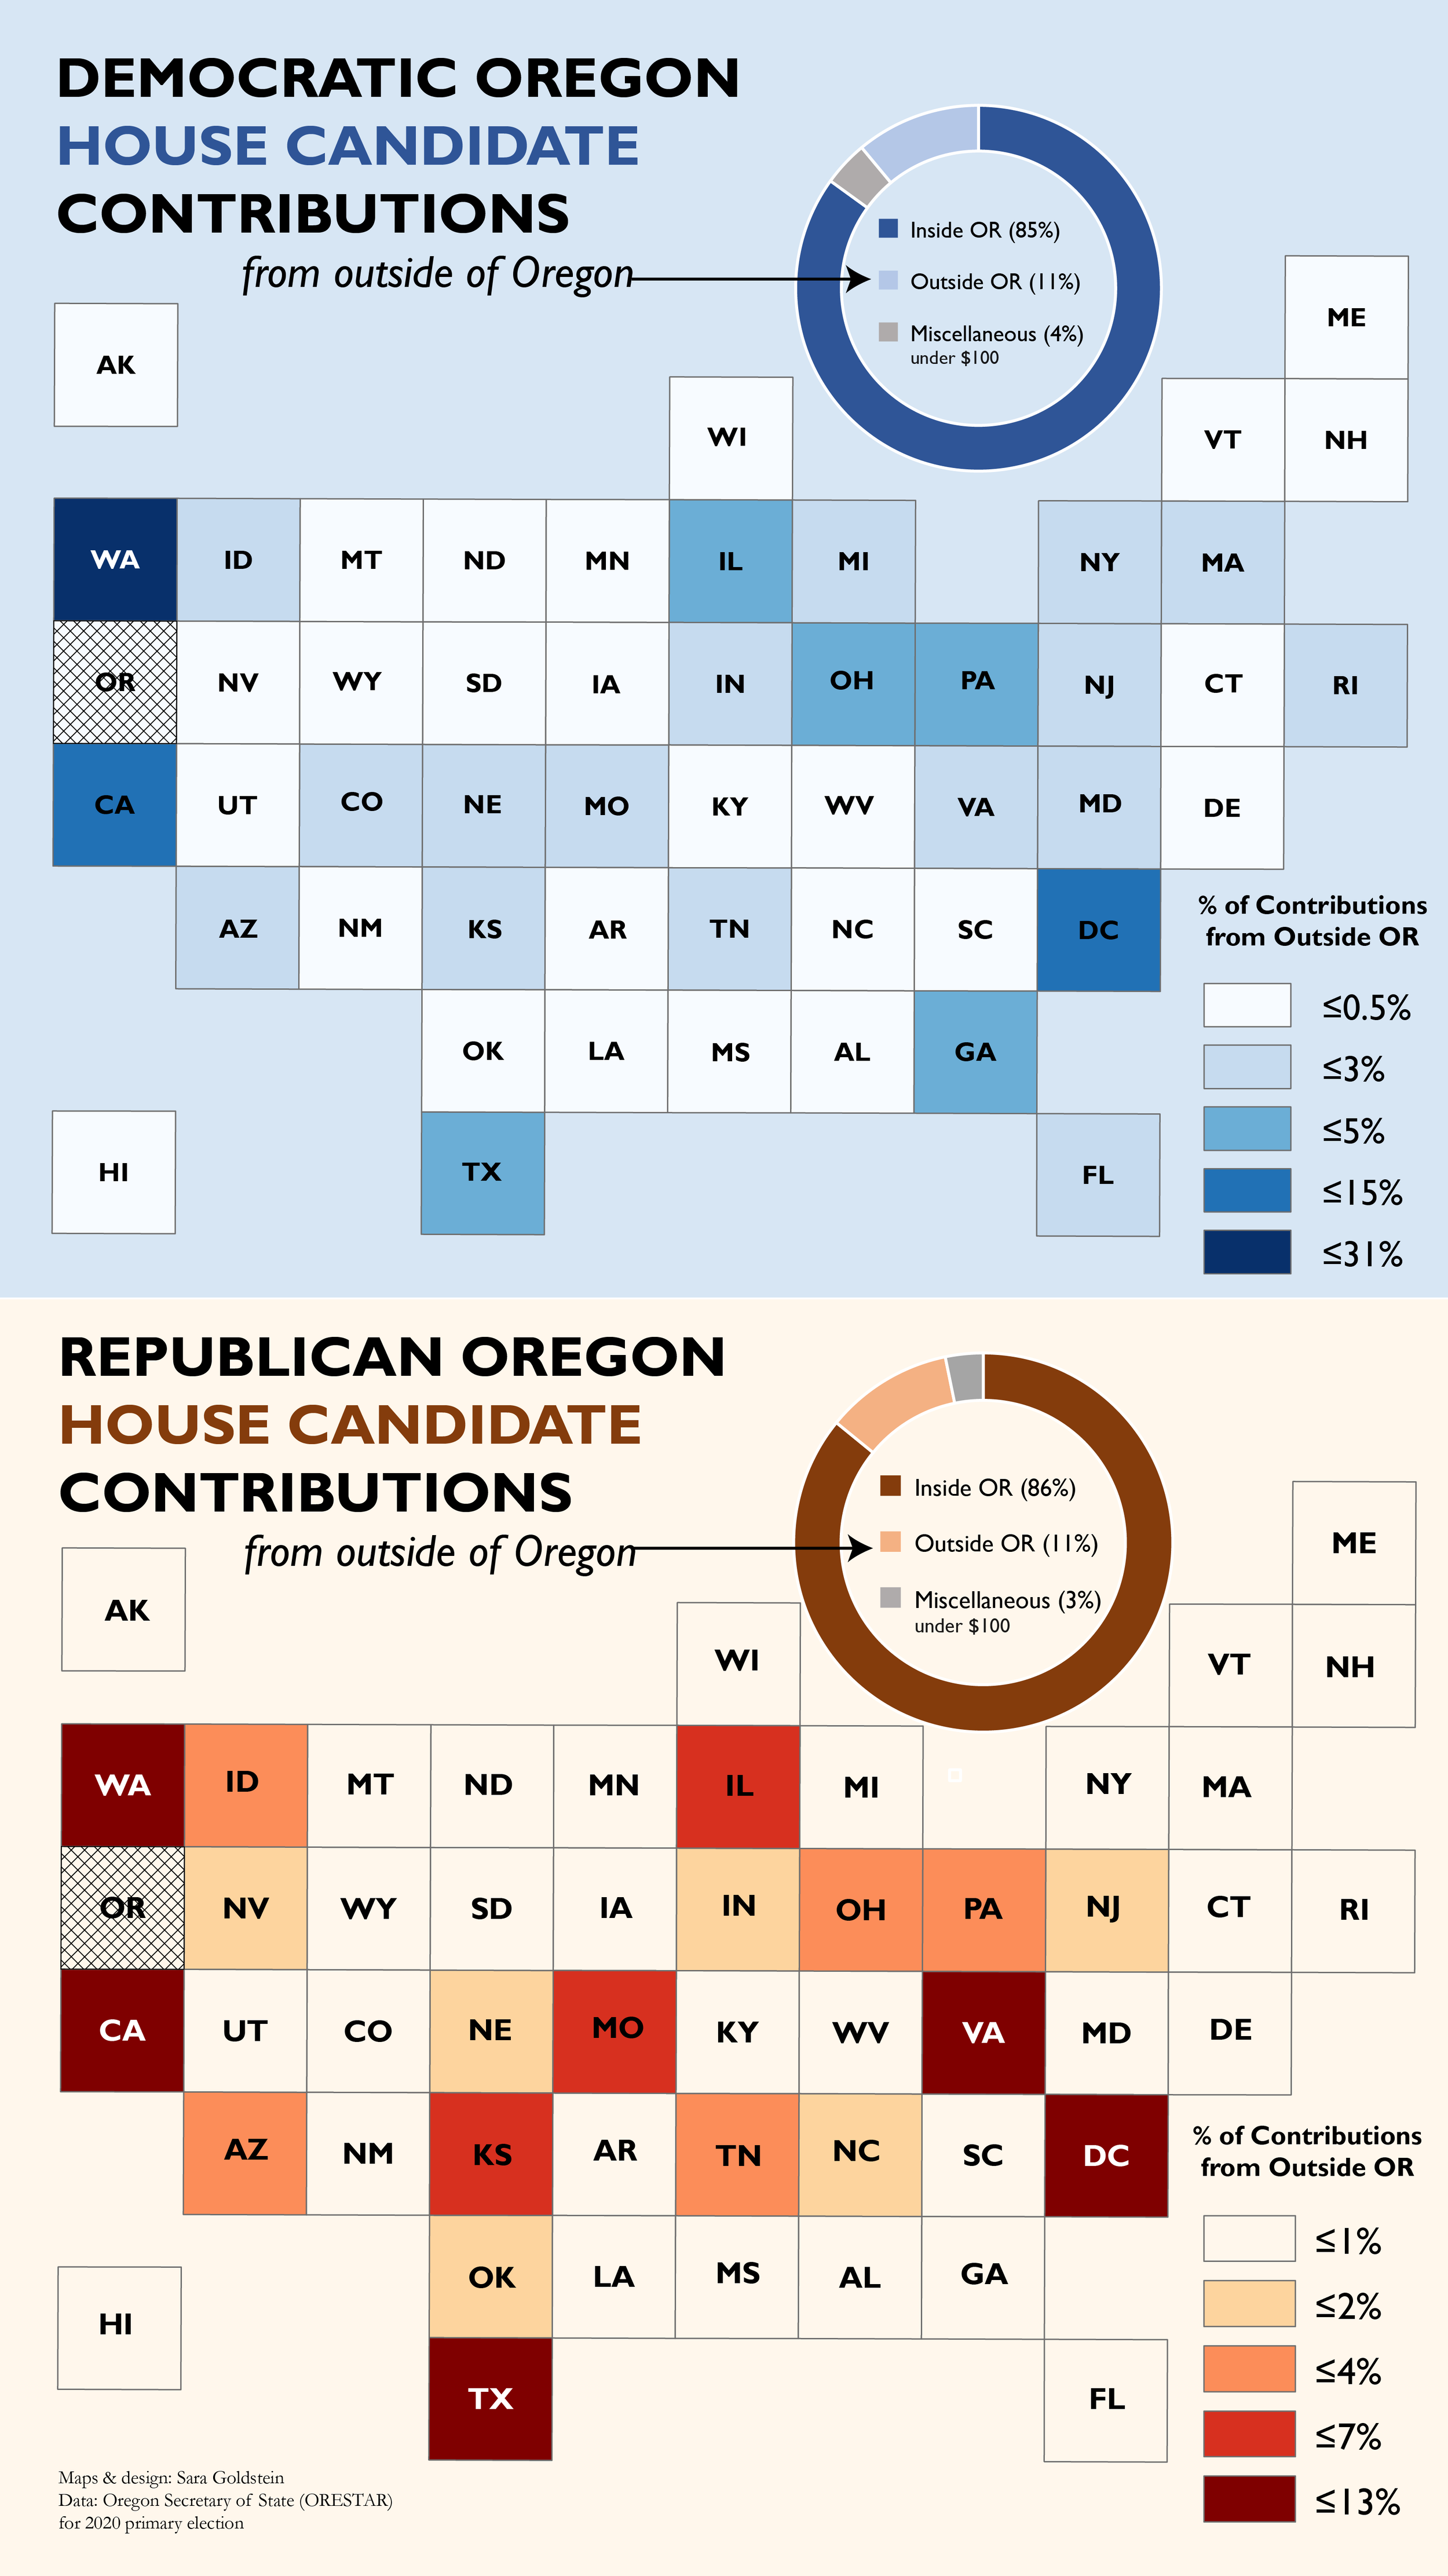
Oregon Campaign Finance
A study on Oregon campaign finance contributions for the 2020 primary election cycle
This project spatially looked at Oregon campaign contributions from the 2020 primary election for data scientist, Daniel Morris to show the spatial distribution of these data, as it pertained to subsets of the House and Senate, and Democratic and Republican parties. The original 7.6 million point dataset was cleaned up in Excel using pivot tables and filters. Analysis, cartography, and design was completed using Adobe Illustrator, ArcPro, and Excel (Visual Basic).


